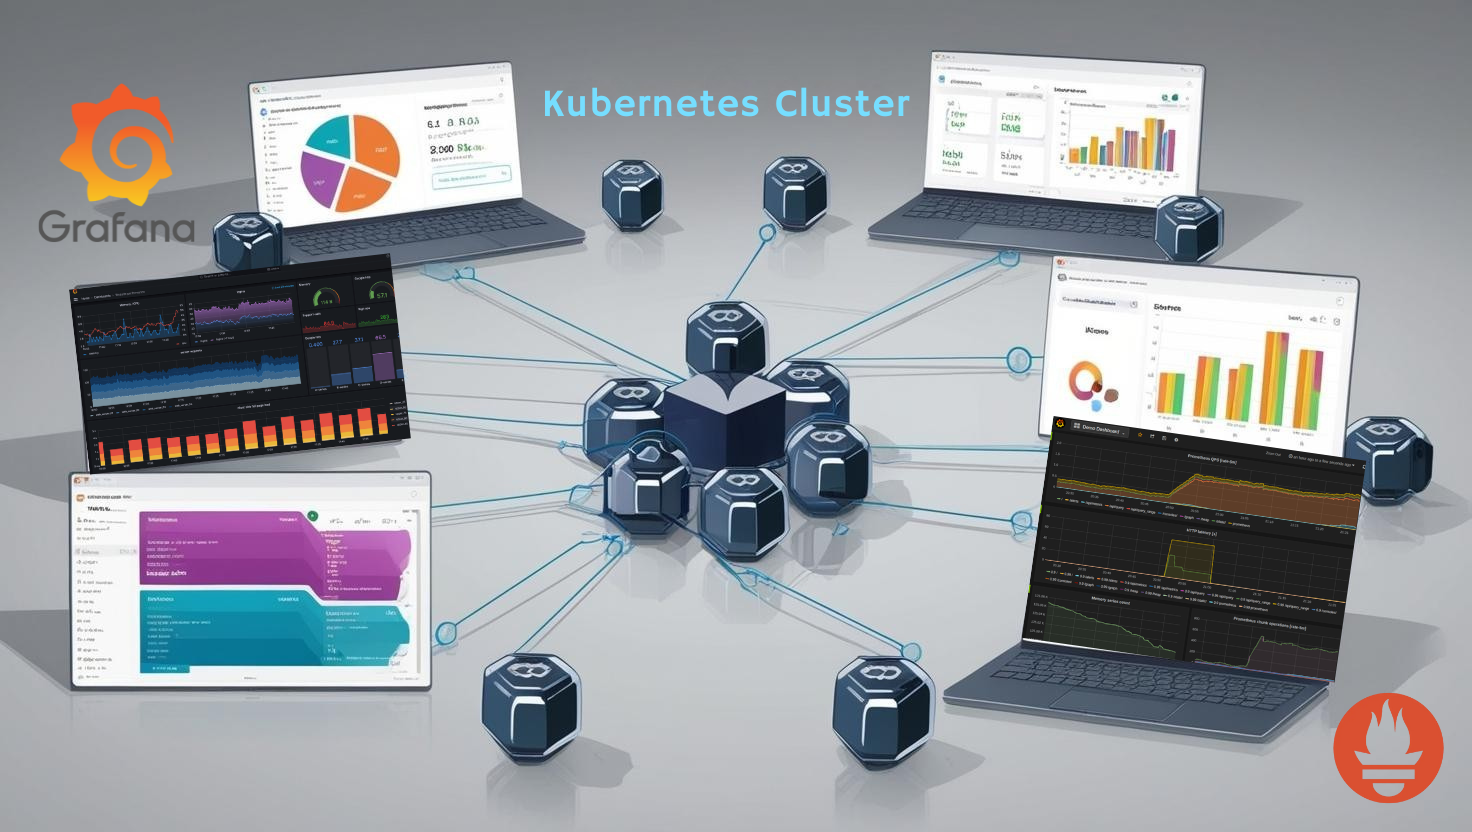
Kubernetes is the backbone of modern container orchestration, and Amazon Elastic Kubernetes Service (EKS) makes deploying Kubernetes clusters seamless. But with great flexibility comes the challenge of monitoring these clusters effectively. This is where Prometheus and Grafana step in as the ultimate monitoring and visualization duo.
In this guide, we’ll walk you through setting up Prometheus and Grafana for monitoring an Amazon EKS cluster. Whether you’re a Kubernetes pro or just starting your cloud-native journey, this step-by-step tutorial will help you keep a close eye on your cluster’s health and performance.
Why Monitor EKS?
Running Kubernetes clusters on EKS involves monitoring multiple components, including nodes, pods, services, and cluster performance. Without proper monitoring, you risk:
- Downtime due to resource constraints: Unchecked usage can lead to resource bottlenecks.
- Unresolved incidents: Identifying issues becomes difficult without granular metrics.
- Underutilization: Insights help optimize resource usage and reduce costs.
Prometheus provides a scalable solution for collecting Kubernetes metrics, while Grafana visualizes them beautifully.
Prerequisites
Before we dive in, ensure you have:
- An active AWS account with an EKS cluster.
- The kubectl command-line tool configured for your cluster.
- Helm, a Kubernetes package manager, installed.
- Administrative access to the cluster.
Step 1: Install Prometheus and Grafana with Helm
To simplify the deployment process, we’ll use Helm charts for both Prometheus and Grafana.
Add the Helm Repository
helm repo add prometheus-community https://prometheus-community.github.io/helm-charts
helm repo update
Deploy Prometheus
helm install prometheus prometheus-community/prometheus \
–namespace monitoring \
–create-namespace
Deploy Grafana
helm install grafana prometheus-community/grafana \
–namespace monitoring
Verify the Deployments
Run the following to ensure Prometheus and Grafana pods are up and running:
kubectl get pods -n monitoring
Step 2: Expose Grafana and Prometheus
By default, Prometheus and Grafana are accessible only within the cluster. To access their dashboards, expose them using NodePort or a LoadBalancer service.
Expose Prometheus
apiVersion: v1
kind: Service
metadata:
name: prometheus-service
namespace: monitoring
spec:
type: NodePort
ports:
– port: 9090
selector:
app: prometheus
Apply the configuration:
kubectl apply -f prometheus-service.yaml
Expose Grafana
For Grafana, use a similar approach:
apiVersion: v1
kind: Service
metadata:
name: grafana-service
namespace: monitoring
spec:
type: NodePort
ports:
– port: 3000
selector:
app: grafana
Apply the configuration:
kubectl apply -f grafana-service.yaml
Step 3: Configure Prometheus to Scrape Metrics
Prometheus relies on targets to scrape metrics. Update the ConfigMap to include Kubernetes metrics endpoints. Use the following command to edit:
kubectl edit configmap prometheus-server -n monitoring
Add the following under scrape_configs:
– job_name: ‘kubernetes-nodes’
kubernetes_sd_configs:
– role: node
Save and reload the Prometheus pod:
kubectl delete pod <prometheus-server-pod-name> -n monitoring
Step 4: Access Grafana and Import Dashboards
Access Grafana using the NodePort URL:
http://<NodeIP>:<NodePort>
- Use the default Grafana credentials:
- Username: admin
- Password: prom-operator
- Import predefined dashboards:
- Go to Dashboards → Import.
- Use the official Grafana dashboard IDs for Kubernetes, such as 6417 or 315.
Step 5: Visualize and Optimize
Once dashboards are imported, you’ll gain insights into:
- Node health: CPU, memory, and disk usage.
- Pod metrics: Resource requests and limits.
- Cluster performance: Overall health and bottlenecks.
Prometheus’s alerting rules can notify you of critical issues, while Grafana’s advanced visualizations help in identifying trends and anomalies.
Step 6: Automate and Secure Your Monitoring Setup
- Set up alerting: Use Alertmanager with Prometheus to receive real-time notifications.
- Integrate authentication: Protect Grafana dashboards with OAuth or SSO integrations.
- Automate with Infrastructure-as-Code (IaC): Use Terraform or Helm charts to version-control your monitoring setup.
Conclusion
By integrating Prometheus and Grafana with Amazon EKS, you unlock the ability to monitor your cluster’s health and performance proactively. This setup not only prevents costly downtimes but also empowers your team to make data-driven decisions for optimization.
Ready to supercharge your Kubernetes monitoring? Contact NimbusStack for expert DevOps solutions and tailored cloud management services.